Model overview · 23 published model years
Subaru Legacy complaints by model year
Compare published NHTSA complaint evidence across Subaru Legacy model years. Each signal is benchmarked within that year's same-segment, same-era cohort, so it is not a mechanical failure rate or complete reliability score.
23
Published model-year records
2,461
Matched complaint incidents
1997
Highest signal in this published set
4.7
Signal for that model year
Model-year records · newest first
Open the evidence for each year
2020Legacy2018 to 2022 midsize sedan3.6interval 3.4 to 4.5121matched incidents2019Legacy2017 to 2021 midsize sedan3.2interval 2.5 to 3.4122matched incidents2018Legacy2016 to 2020 midsize sedan2.0interval 1.6 to 2.6116matched incidents2017Legacy2015 to 2019 midsize sedan1.7interval 1.3 to 2.3118matched incidents2016Legacy2014 to 2018 midsize sedan2.3interval 1.7 to 2.7145matched incidents2015Legacy2013 to 2017 midsize sedan2.3interval 1.9 to 2.5159matched incidents2014Legacy2012 to 2016 midsize sedan0.3interval 0.3 to 0.753matched incidents2013Legacy2011 to 2015 midsize sedan0.7interval 0.5 to 1.166matched incidents2012Legacy2010 to 2014 midsize sedan1.1interval 0.9 to 1.390matched incidents2011Legacy2009 to 2013 midsize sedan2.5interval 2.0 to 2.5167matched incidents2010Legacy2008 to 2012 midsize sedan2.3interval 1.7 to 2.9150matched incidents2009Legacy2007 to 2011 midsize sedan0.7interval 0.5 to 0.965matched incidents2008Legacy2006 to 2010 midsize sedan0.3interval 0.3 to 0.765matched incidents2006Legacy2004 to 2008 midsize sedan0.7interval 0.5 to 0.787matched incidents2005Legacy2003 to 2007 midsize sedan3.3interval 1.9 to 3.7182matched incidents2003Legacy2001 to 2005 midsize sedan0.6interval 0.1 to 0.860matched incidents2002Legacy2000 to 2004 midsize sedan0.4interval 0.1 to 0.654matched incidents2001Legacy1999 to 2003 midsize sedan0.6interval 0.4 to 1.277matched incidents2000Legacy1998 to 2002 midsize sedan1.5interval 0.7 to 2.094matched incidents1999Legacy1997 to 2001 midsize sedan1.5interval 1.0 to 2.494matched incidents1998Legacy1996 to 2000 midsize sedan3.1interval 2.2 to 4.0114matched incidents1997Legacy1995 to 1999 midsize sedan4.7interval 3.8 to 4.7139matched incidents1996Legacy1994 to 1998 midsize sedan4.0interval 3.3 to 4.8123matched incidents
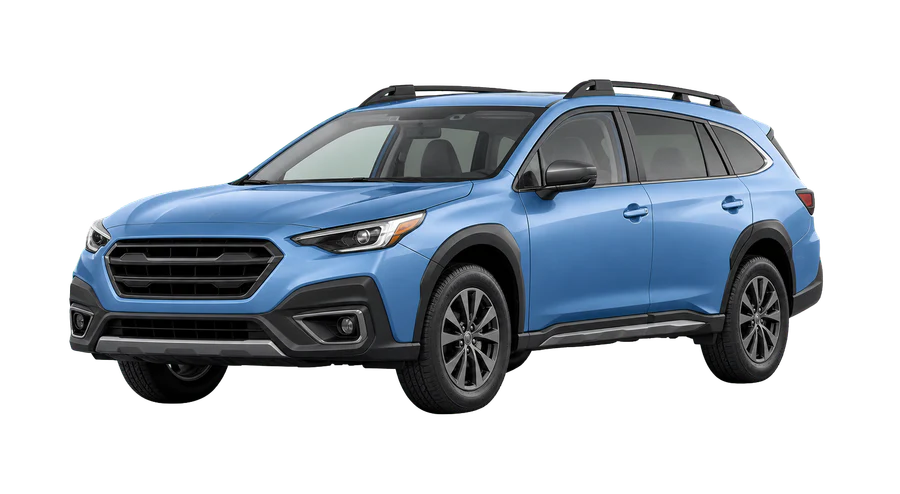
How to read this: a higher complaint signal means that model year has a louder complaint record relative to its peer cohort. It does not establish overall reliability, ownership cost, or a recommendation to avoid that year.
731 published model-years · free · no login
Pick a make and pull the record
Browse NHTSA complaint-signal records with visible sample sizes, intervals, and limitations. The current data snapshot is dated 2026-07-19.