Evidence-qualified board · snapshot 2026-07-19
The worst model years by complaint signal
MotorCensus screened 874 model years. 143 meet the confidence-interval flag rule overall, and 124 of 731 published records meet it. These are complaint signals, not fleet shares or failure rates.


The complete board · ranks 04 to 124 of 124 published flags
Every published flagged record
Ranks 1 to 3 are listed above. This board continues with every other published flagged record, ordered by signal index and report count. Each row shows its confidence interval and report total. The cohort-relative index describes complaint intensity, not a mechanical failure rate.
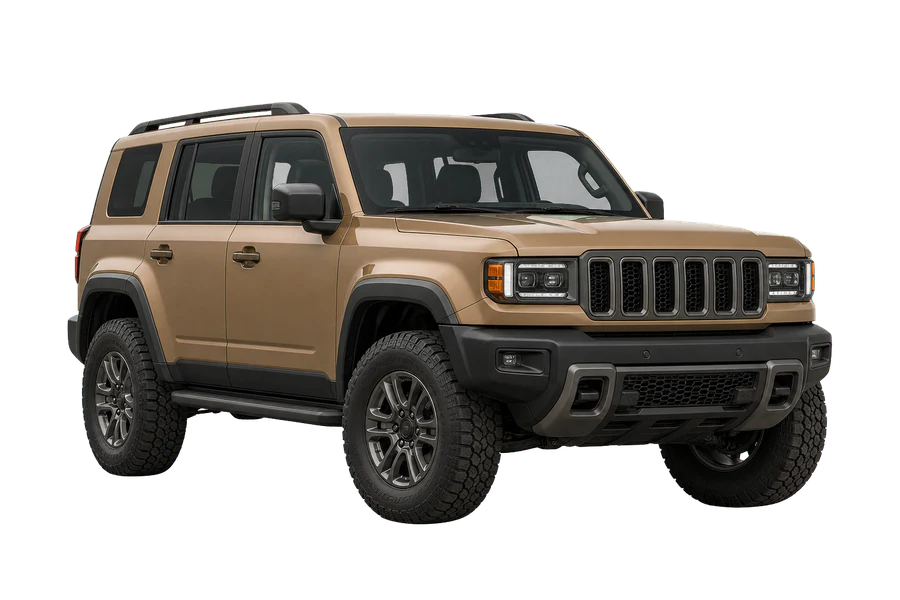

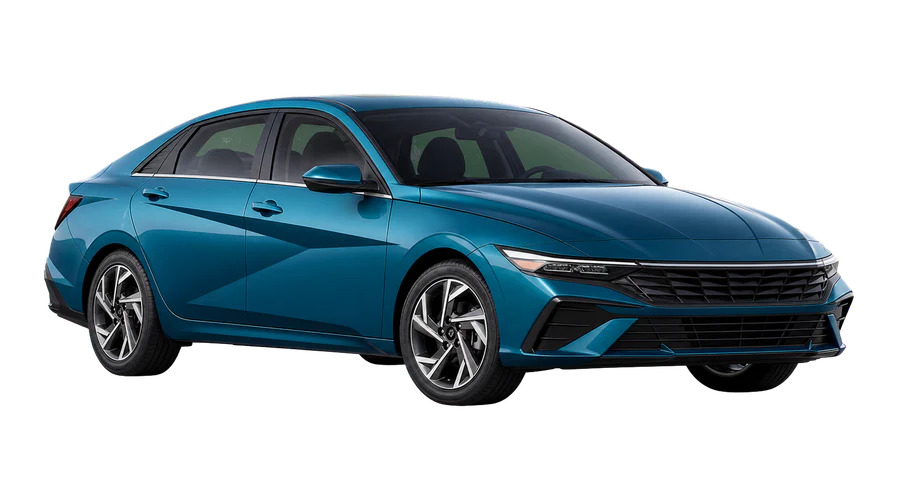




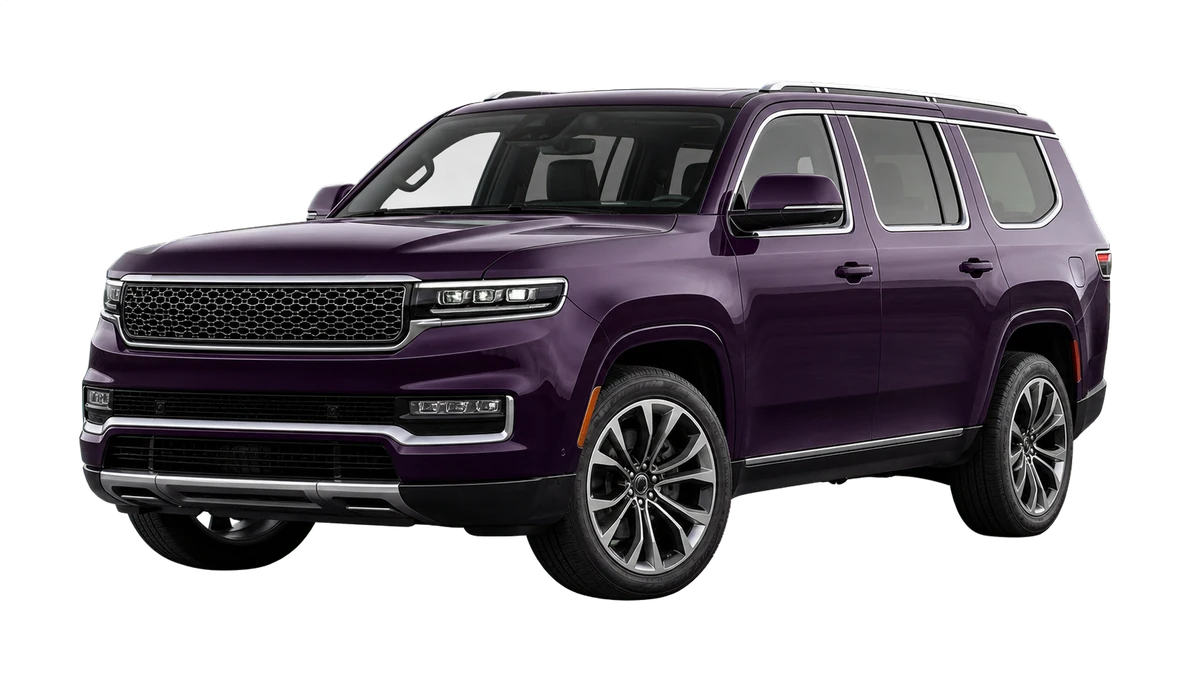
One car stands for all of them
Behind every rank a component
A ranked model-year must clear the publication gates and the confidence threshold. Each entry links to its record so the supporting component, mileage, trend, and peer evidence can be inspected.
Methodology · the short version
How a flag is earned
Screen
The pipeline grouped 2,155,302 vehicle component rows into 398,146 deduplicated matched complaint incidents. Each retained model year is compared within a same-segment, same-era cohort after age adjustment. The complaint-signal index is not fleet-normalized.
Score
Each cohort produces a 0 to 10 complaint-signal index with a bootstrapped 95% interval. No interval, no number on the site.
Flag
A model year is flagged when its whole 95% interval is at least 8.0. The current snapshot has 143 flags overall and 124 among 731 published records.
731 published model-years · free · no login
Check a model-year before the test drive
Browse NHTSA complaint-signal records with visible sample sizes, intervals, and limitations. The current data snapshot is dated 2026-07-19.